Charity overhead explained: what the percentage does and does not tell you

On this page9 sections
- What counts as charity overhead, and what does not
- How to calculate the overhead ratio and the program expense ratio
- Is there a good overhead percentage? What watchdogs actually require
- Why overhead percentages differ from country to country
- What a charity's overhead percentage tells you, band by band
- Why lower overhead is not always better: the overhead myth
- How to use overhead when you research a charity
- How GiveRadar treats overhead in its integrity assessment
- Frequently asked questions
Charity overhead is the share of a charity's spending that goes to management, administration and fundraising rather than its programs. There is no official "good" percentage. US watchdogs set program spending floors between 65% and 75%, but none of them rewards lower overhead beyond that point, and a low figure can reflect underinvestment or accounting choices rather than efficiency.
In short
- Overhead is management and general costs plus fundraising costs. Program staff salaries are not overhead.
- No regulator or watchdog publishes a "good" overhead percentage; the thresholds that exist are program spending floors of 65% to 75%.
- Overhead is reported differently per country, so never compare percentages across borders.
- A program share above 90% deserves as much scrutiny as one below 65%.
- Use overhead as a first filter, then look at transparency, governance and results.
What counts as charity overhead, and what does not
Charity overhead covers two kinds of spending: management and general costs, such as accounting, audits, insurance and leadership time spent running the organization, and fundraising costs. Spending that delivers the charity's work, including the salaries of staff who run programs, counts as program spending, not overhead.
Charity overhead: management and general costs plus fundraising costs. Everything that delivers the charity's work is program spending.
The National Council of Nonprofits also splits overhead into management and general costs and fundraising costs. Management and general covers support staff, IT, legal services and insurance; fundraising includes applying for grants, as economist Jonathan Meer notes in IZA World of Labor.
The most common misunderstanding is that every salary counts as overhead. Charity Navigator explains that the time an employee spends delivering programs is a program cost, as is a van bought for meal deliveries. At small charities, even senior managers often spend part of their time on programs.
Shared costs are split by function. CharityWatch gives the example of an executive who spends 50% of their time on programs, 20% on accounting and management and 30% on fundraising: only half of that salary counts as overhead, and the salaries of program staff count as none of it.
How to calculate the overhead ratio and the program expense ratio
The overhead ratio is management and general expenses plus fundraising expenses, divided by total expenses. The program expense ratio is the other side of the same number: program expenses divided by total expenses, so a charity with 20% overhead has an 80% program expense ratio.
Overhead ratio = (management and general expenses + fundraising expenses) / total expenses
Program expense ratio = program expenses / total expenses
The same figures are often called the nonprofit overhead ratio and the nonprofit program expense ratio.
Example: USD 800,000 on programs, USD 100,000 on management and USD 100,000 on fundraising gives 20% overhead and an 80% program expense ratio.
In the United States the overhead figures sit in Form 990, Part IX: the BBB Wise Giving Alliance divides program expenses (line 25, column B) by total expenses (column A). You can look up a charity's Form 990 and do the same.
Fundraising efficiency is a separate ratio: fundraising costs against the donations they raised, which CharityWatch expresses as the cost to raise USD 100.
The overhead ratio is a whole-year average, not a forecast for your gift. Because costs such as rent are fixed, Meer notes, an extra donation is not spent on overhead at the average rate.
Is there a good overhead percentage? What watchdogs actually require
No regulator or watchdog publishes a single "good" overhead percentage. The thresholds that do exist are floors for program spending: at least 65% for the BBB Wise Giving Alliance, a 70% preference at Charity Navigator and 75% for CharityWatch's highly efficient rating.
You will often read that 15% to 25% overhead is the healthy range. None of the organizations in the table below uses that range.
| Organization | What it measures | Threshold | Notes |
|---|---|---|---|
| BBB Wise Giving Alliance | Program expenses / total expenses; fundraising / related contributions | At least 65% on programs; at most 35% of related contributions on fundraising | Accepts explanations, for example from new organizations or for donor restrictions |
| Charity Navigator | Program expense ratio, one input in a wider rating | Prefers 70% or more | No extra points above 70%; a failing ratio can count for as little as 2% of the rating |
| CharityWatch | Program share and cost to raise USD 100, after its own adjustments | 75% or more and USD 25 or less for "highly efficient" | Adjusts reported figures for donated goods and joint costs before grading |
| Canada Revenue Agency | Fundraising costs / receipted donations and fundraising revenue | Under 35% unlikely to raise questions; above 70% needs an explanation | Tests fundraising costs, not total overhead |
Charity Navigator says it sees no evidence that a program share above 70% leads to greater impact. CharityWatch is the strictest: its analysts adjust a charity's reported figures before grading (read how CharityWatch grades charities).
The BBB Wise Giving Alliance, Charity Navigator and CharityWatch are all American. Canada's regulator tests fundraising costs instead, which is where comparisons between countries break down.
Why overhead percentages differ from country to country
There is no international definition of overhead, because each regulator asks charities to report spending differently. A US Form 990 splits every expense into program, management and general, and fundraising, while UK accounts allocate support costs into charitable activities and Canada's regulator focuses on fundraising costs against donations.
US charities filing a full Form 990 allocate every operating expense to one of the three functions, as CharityWatch describes. The Canada Revenue Agency divides fundraising expenses on the T3010 return (line 5020) by receipted donations and other fundraising revenue (lines 4500 and 4630); at 35% and above it reviews recent years, above 70% the charity must explain.
Accounts in England and Wales follow the Charities SORP, which reports spending on raising funds and on charitable activities and folds support costs into those activities, as this introduction to the SORP sets out.
| Country | What the filing reports | Can you calculate overhead? |
|---|---|---|
| United States, Form 990 | Program, management and general, fundraising | Yes |
| Canada, T3010 | Charitable programs, management and administration, fundraising, plus gifts to other charities | Yes, on a different basis; the CRA's own test is the fundraising ratio |
| England and Wales, SORP accounts | Raising funds and charitable activities, with support costs allocated | No clean administration line |
Even the same label can measure different things. Canada's total expenditure includes gifts to other charities, so the median Canadian charity's 85.0% share on charitable programs in 2023 is not the same number as a US program expense ratio, according to GiveRadar's analysis of register filings.
Some countries cap overhead outright: South Korea at 10% of funds raised, and Austria for certain administrative costs at 10% of donations, according to Meer. Elsewhere the data is thin: GiveRadar's research could not use Latvia's filings because they lack usable income and spending figures.
Compare overhead only within one country, ideally within one size band. Before you compare anything, check a charity's registration in its own country so you know which regulator's rules apply.
What a charity's overhead percentage tells you, band by band
A program share above 90% deserves as much scrutiny as one below 65%. High figures can be inflated by how donated goods and shared fundraising costs are booked, and low figures can reflect a new organization, restricted grants or a genuine problem.
The program share bands below help you read a figure and are not a rating. Shares come from GiveRadar's analysis of register filings covering 252,844 US charities that filed a full Form 990 for 2023, whose median program expense ratio is 86.1%.
| Program share | Share of US Form 990 filers, 2023 | What it can mean | What to check |
|---|---|---|---|
| 95% or more | 25.8% | Costs often not split across functions, or inflated by donated goods (in-kind gifts) or joint costs | Whether management and fundraising costs are reported at all; the notes on donated goods and joint costs |
| 90% to 94.9% | 13.4% | Efficient, or a generous allocation of shared costs | Donated goods and joint costs in the notes |
| 75% to 89.9% | 36.1% | Meets every US watchdog floor | The trend over three years and the cost of fundraising |
| 65% to 74.9% | 11.3% | Meets the BBB standard, below CharityWatch's top band | The charity's size and stage |
| Below 65% | 13.4% | Misses the BBB standard | Why: a new organization, restricted grants, an exceptional bequest, or at the extremes poor management |
The chart below breaks the same filings down by size. The median program share is highest for the smallest charities (90.0%) and lowest for those with USD 1 million to 10 million in revenue (84.2%). Small charities vary far more: the middle half of filers under USD 100,000 runs from 67.9% to 100%, while above USD 100 million it sits between 82.5% and 93.1%. The median of every band clears both the 65% and the 75% floor.
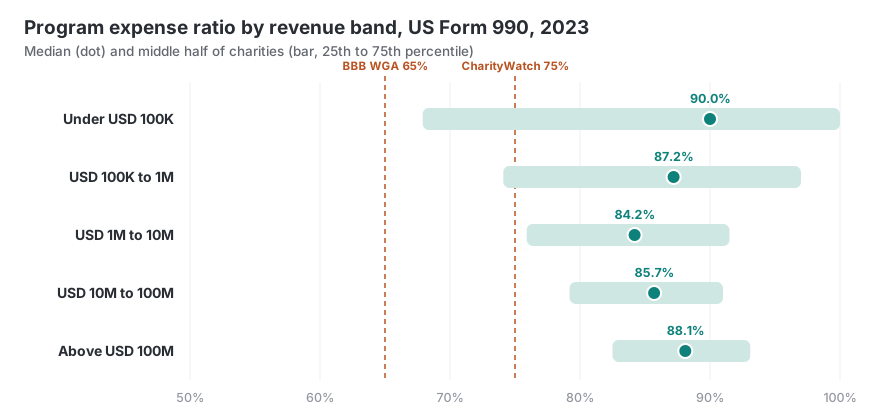
Source: GiveRadar analysis of IRS Form 990 filings, data snapshot 21 October 2026, 20:36 UTC.
Question the 95% or more band first. In GiveRadar's data, 11.5% of US filers report exactly 100% of their expenses as program spending, rising to 25.2% among charities with revenue under USD 100,000; a quarter of those smallest filers report no management and no fundraising costs at all. A 100% figure usually reflects costs that were never split across functions rather than a charity with no overhead.
Reported overhead figures tend to be too low. In the Stanford Social Innovation Review, Bridgespan describes four youth charities that reported 13% to 22% overhead against an actual 17% to 35%, and a study of more than 220,000 Form 990s in which over a third reported no fundraising costs. Meer adds that one fifth of charities with donations above USD 5 million did the same.
In GiveRadar's 2023 data, 58.8% of US full Form 990 filers, and 45.7% of those spending more than USD 5 million, report zero fundraising costs. A zero is not always wrong, since a charity funded by fees, contracts or grants may genuinely have none, but the BBB Wise Giving Alliance usually fails statements that report no fundraising expenses on accurate expense reporting.
At the low end of program spending, overhead is informative: the 2013 Overhead Myth letter calls it a valid data point for rooting out fraud and poor financial management at the extremes. A share far below the floors is a reason to check the warning signs of charity fraud and ask the charity directly.
Why small charities often show higher overhead
Small charities carry fixed costs, such as an audit, insurance and basic administration, that weigh more heavily on a small budget. Most registered charities are small: 60.4% of charities filing in England and Wales report income under GBP 100,000, according to GiveRadar research.
Charity Navigator states that a small local charity needs a different amount of overhead than a large national one, and the Canada Revenue Agency judges charities under CAD 100,000 in the context of the community they serve.
The median filer in England and Wales reported GBP 59,934 in income, according to GiveRadar's research showing that most registered charities are small. In GiveRadar's 2023 data, small US charities also vary far more: 23.2% of full Form 990 filers under USD 100,000 report less than 65% on programs, against 2.4% above USD 100 million.
Why lower overhead is not always better: the overhead myth
In June 2013 the heads of the BBB Wise Giving Alliance, GuideStar and Charity Navigator wrote to donors that overhead is a poor measure of a charity's performance and that many charities should spend more on it. Underfunding overhead feeds what researchers call the nonprofit starvation cycle.
The Overhead Myth letter asked donors to look at transparency, governance, leadership and results instead, and described overhead as investment in training, planning, evaluation and internal systems.
Gregory and Howard named the starvation cycle in 2009: funders expect running a nonprofit to cost less than it does, charities feel pressure to conform, and they underspend and underreport. The low reported figures confirm the expectations, and the cycle repeats.
Donors play their part in the starvation cycle. Meer reviews evidence that donors avoid charities with high overhead even when those costs say nothing about quality. In a field experiment with 40,000 potential donors, Gneezy, Keenan and Gneezy found that telling people an initial gift already covered overhead raised total donations by 75% compared with simply announcing that seed money had been raised.
A study of 22,328 arts and cultural nonprofits, summarized by Florida Atlantic University, found attendance was highest at about 35% overhead. Because the study covers arts and attendance only, 35% is no target for other charities.
CharityWatch makes the counterargument: most donors cannot evaluate impact themselves, and financial efficiency remains one of the few practical ways to screen out poorly run charities and predatory fundraisers. CharityWatch and the Overhead Myth letter agree on one point: overhead is a starting point, not the answer.
How to use overhead when you research a charity
Use overhead as a first filter, then move on. Read the latest filing yourself, check three years rather than one, and compare only with charities of a similar size in the same country before you look at governance, transparency and results.
- Find the latest official filing. The filing is Form 990 in the United States, the T3010 return in Canada and the annual accounts elsewhere.
- Calculate the ratios yourself. Divide program expenses by total expenses, then compare fundraising costs with the donations they raised, as the BBB Wise Giving Alliance and CharityWatch do.
- Look at three years. One unusual year often has a reason; a pattern over several years tells you more.
- Read the notes. Check whether fundraising costs are reported at all, how donated goods are valued and whether appeal costs were booked as program spending.
- Compare like with like. Stay within one country and one size band.
- Then look beyond the money. The 2013 Overhead Myth letter points to transparency, governance, leadership and results. For evidence of impact, turn to evaluators that study it, such as GiveWell.
Overhead is one line on a longer list, and a nonprofit due diligence checklist covers the rest, from registration to governance.
How GiveRadar treats overhead in its integrity assessment
GiveRadar's integrity assessment does not score overhead. Since June 2026 its Financial Transparency component rewards whether a charity discloses its finances, not whether the split looks good, because overhead ratios judge financial shape rather than transparency.
The earlier overhead-ratio points and program spending tiers were removed in June 2026. One financial signal remains: a red flag when top executive pay exceeds 10% of total expenses, severe above 20%. Read how GiveRadar's integrity assessment works.
GiveRadar's charity pages show the program share where GiveRadar holds it; a free account adds the full split and the fundraising cost per dollar raised.
Search 7.9 million+ charities in 100+ countries on GiveRadar to read a charity's filings and integrity assessment before you give.
Frequently asked questions
How much do charities spend on overhead on average?
There is no reliable global average, because countries define and report overhead differently. In the United States, the median charity filing a full Form 990 reported 86.1% of its 2023 expenses as program spending, which means about 14% overhead, according to GiveRadar's analysis of 252,844 filings. Reported figures tend to understate overhead: four US youth charities studied by Bridgespan reported 13% to 22% while their actual overhead was 17% to 35%.
Does charity overhead include staff salaries?
Only partly. Salaries of staff who deliver programs count as program expenses, while time spent on management, accounting or fundraising counts as overhead. A director who spends half their time on programs has half their salary reported as program spending.
What overhead percentage is too high?
There is no single cut-off, but published thresholds give a range. A charity spending less than 65% of its expenses on programs misses the BBB Wise Giving Alliance standard, and CharityWatch's grading scale places a program share of 35% or less in its F range. In Canada, fundraising costs above 70% of donations must be explained to the CRA. The 2013 Overhead Myth letter notes that overhead is most useful at such extremes, to root out fraud and poor financial management.
What is a normal overhead percentage for UK charities?
UK charity accounts do not report a single overhead figure. Under the Charities SORP, support and governance costs are allocated to charitable activities, so the closest comparison is spending on raising funds against spending on charitable activities.




Comments
Leave a comment
Log in or create a free account to join the conversation.
Thanks, your comment will appear after review.